Exam Sitting Reports
How to view a variety of reports on an exam sitting
We have built-in several key reports that allow you to extract key insights on each of your exam sittings.
Important information regarding available reporting data
Currently, reporting data is only available for exam submissions that were submitted after the report type was released. This means that any submissions submitted before the date shown below will not be included in the report.
We are working on making this data available and will update documentation when this data becomes available.
| Report type | Available for submissions on or after |
|---|---|
| Average time spent per question | July 6th, 2023 |
| Auto-scored question performance | September 5th, 2023 |
| Time to complete | September 5th, 2023 |
| Engagement | All time |
| Pass/Fail | June 9th, 2023 |
| Additional time usage | All time |
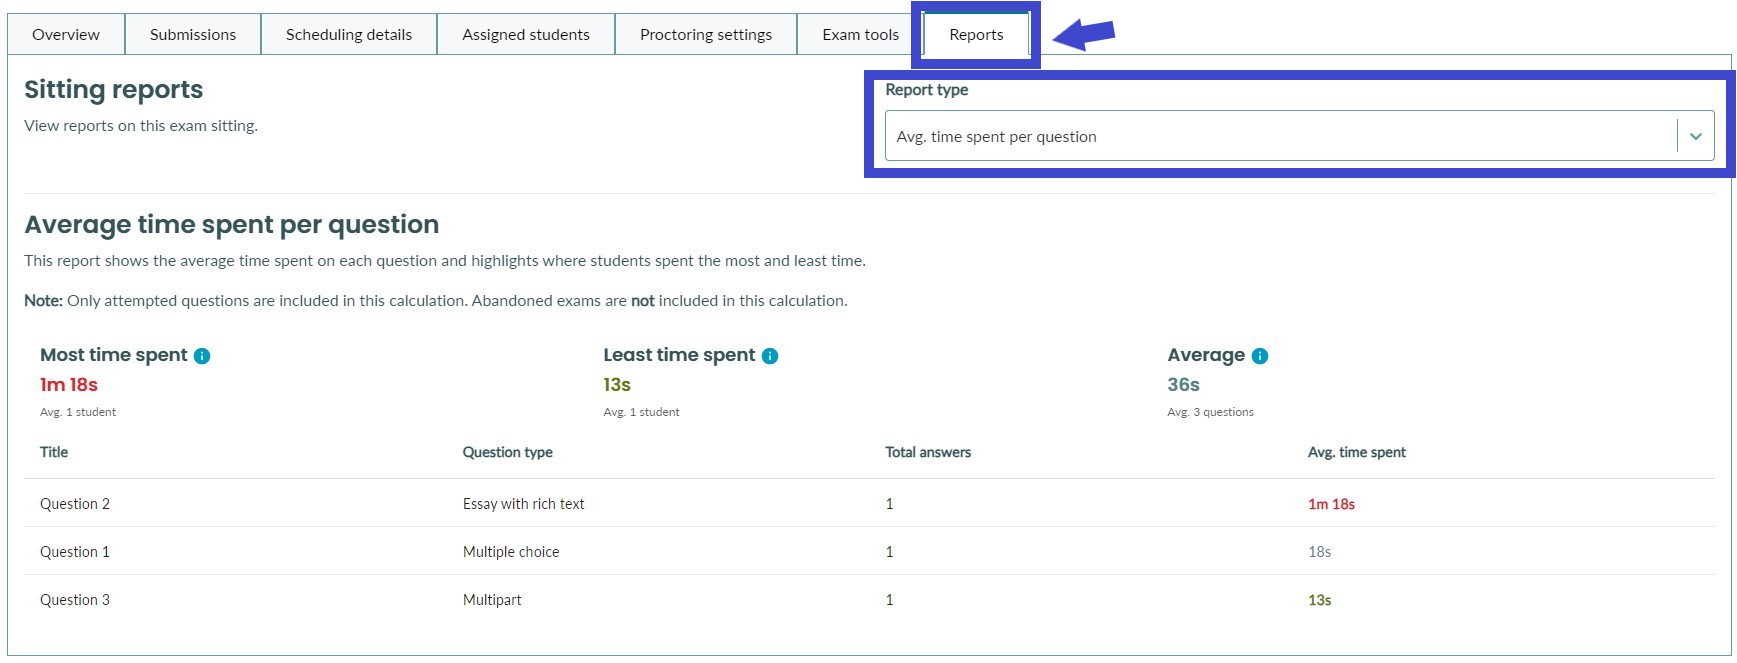
To view exam-sitting reports, open the exam sitting and select the 'Reports' Tab. You can switch between the Report type by using the dropdown menu on the top right.
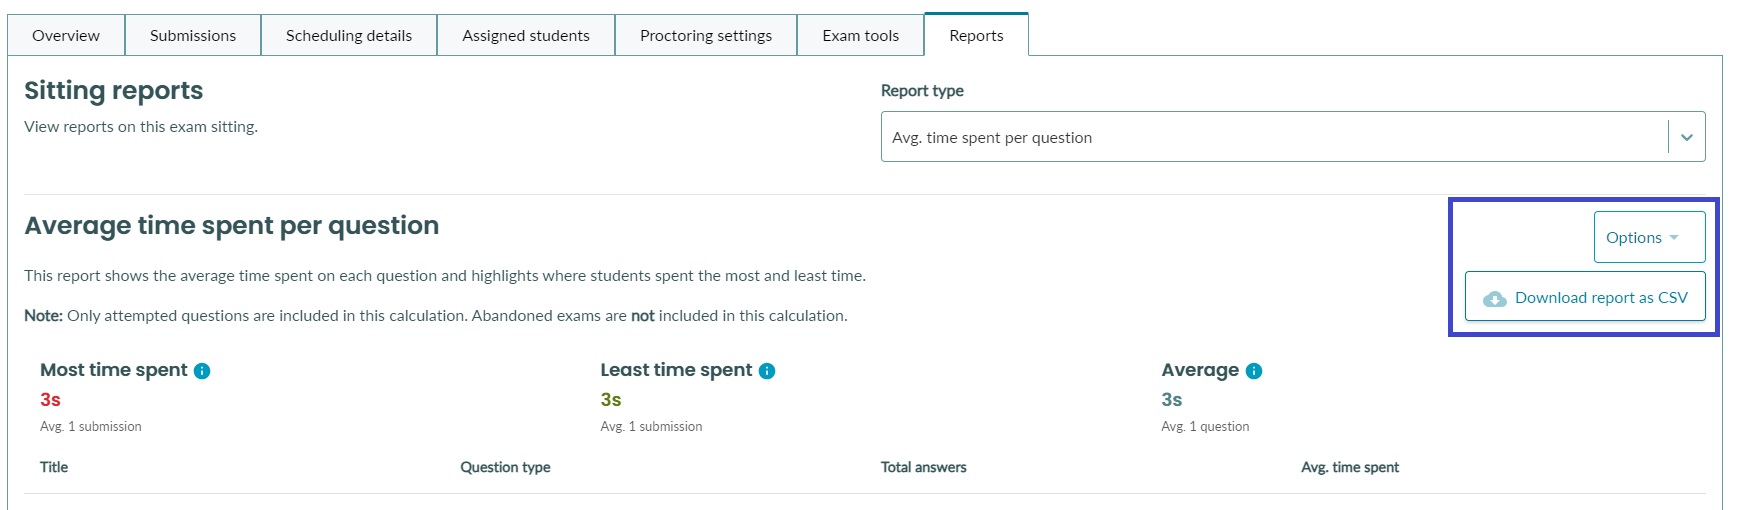
Exporting reports to CSV
It is possible to export any of the below reports to a CSV file.
To export a report to CSV, select the 'Options' dropdown, and click on 'Download report as CSV'
Average time spent per question
This report tells you the following information
- How much time students spent on average on each question
- What question students spent, on average, the most time on
- What question students spent, on average, the least time on
- The average time spent on any question
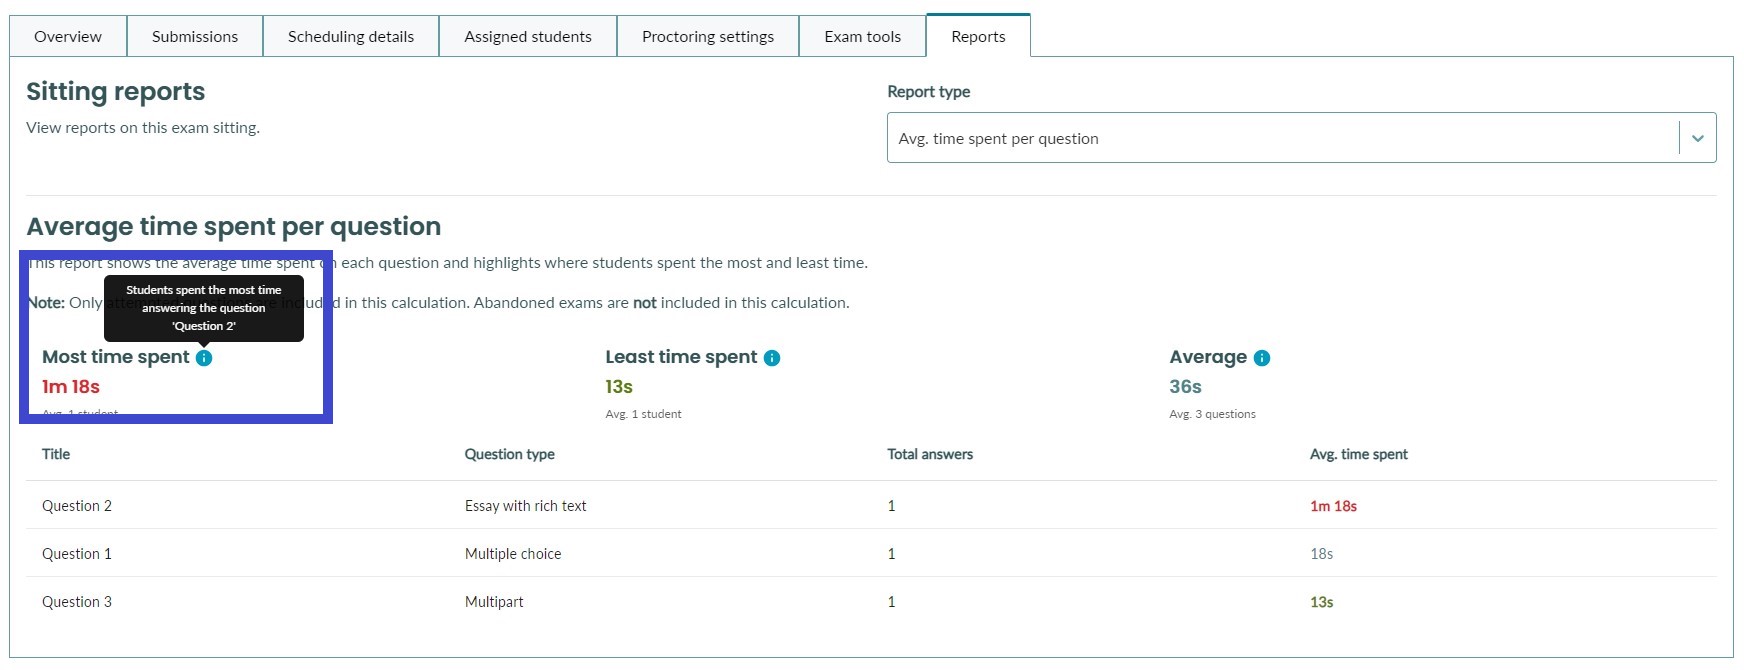
To view more details about most time spent, least time spent, and average time spent overall, hover over the blue icon to see the details tooltip
Auto-scored question performance
This report shows how students performed on auto-scored questions. It gives a breakdown of each question and how many students got the question correct (full marks) versus incorrect.
This report gives you insights into question difficulty and helps identify problematic questions that might be 'too easy' or 'too difficult'.
To view this report, select 'Auto-scored question performance' from the report dropdown

Your report will look like this and show
- The question title
- The question stem
- The question type
- Total number of students that got full marks on the question (Correct)
- Total number of students that did not get full marks on the question (Incorrect)
- P-Value
- Discrimination Index
What is the P-Vaue and how is it calculated?
P-Value is used to determine the relative difficulty of a question based on a normalised value (between 0 and 1). In other words, how likely is a student to get full marks on the question (on a scale of 0 to 1). The closer to 1 the P-Value is, the 'easier' the question is. The calculation is rather simple for this one. It is just the total number of students who got full marks on the question divided by the total number of students that were delivered the question. It is rounded to 2 decimal places.
What is the discrimination index and how is it calculated?
The discrimination index indicates the extent to which success on a question corresponds to success on the whole test. The discrimination index (DI) is calculated by taking the top 27% of submissions (U) and the bottom 27% of submissions (L) and dividing by 6.
The formula is: DI = (U-L)/6 (rounded to the nearest 10th)
NOTE: To see this calculation, there must be at least 6 submissions for the exam sitting.
Detailed Auto-scored question performance report
A more detailed report on auto-scored question performance is available for download as a PDF. This detailed report gives administrators a granular, item-by-item view of how auto-scored questions performed across an exam. Use it when you run large-scale evaluations with subject matter experts (SMEs) and need consistent evidence to decide whether to keep, revise, or remove questions, update images, adjust difficulty, or refine answer options.
To generate the full question report
1. Navigate to the reports tab
2. Select 'Auto-scored question performance'
3. Select the options dropdown and select 'Generate full question report'
The report will be generated, and a download link will be sent to your email address. 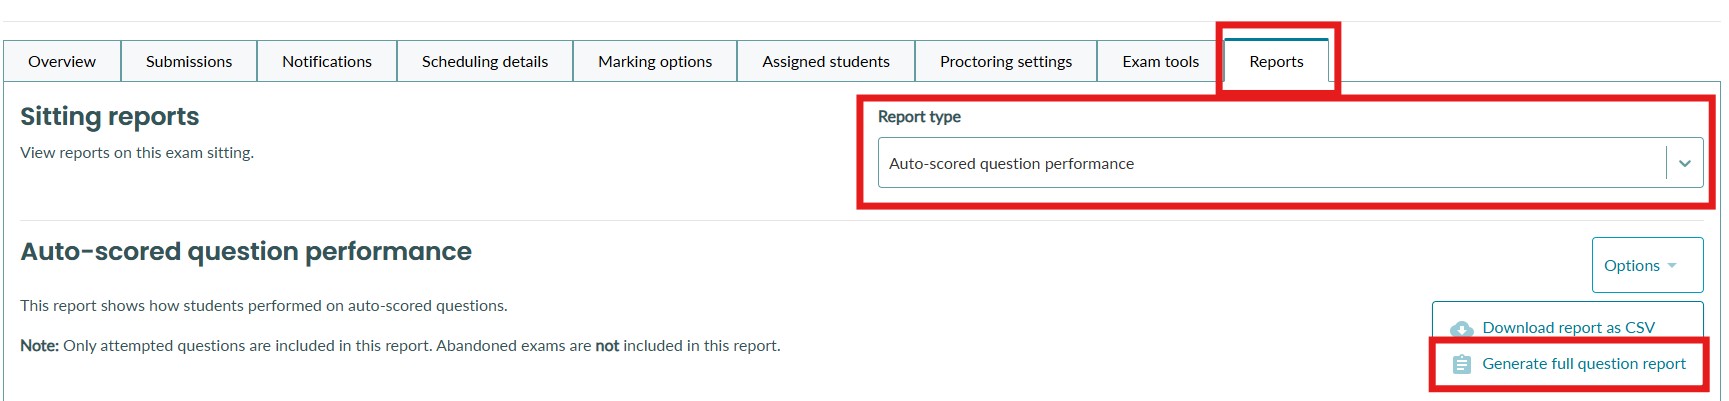
The detailed report includes the following information on each question
-
Question title
-
Question type (example: multiple choice, choice matrix)
-
Last updated (date of most recent change to the item)
-
Section (example: Introduction to the RIPE Database 1.1)
-
Points (points awarded for a fully correct response)
-
Alternative performance (for each alternative: percent of responses selecting it, plus the average score achieved by candidates who selected it)
-
Tags (example: easy, medium)
-
Folder name (example: Section 1 - 1.1 Easy)
-
Frequency (how many times the question has been answered)
-
Discrimination index
-
P value
-
Average time to answer (typically shown as a time value per item)
-
The question content (including any attached images)
-
Alternatives (answer options, with the correct answer marked by an asterisk )
Time taken to complete the exam
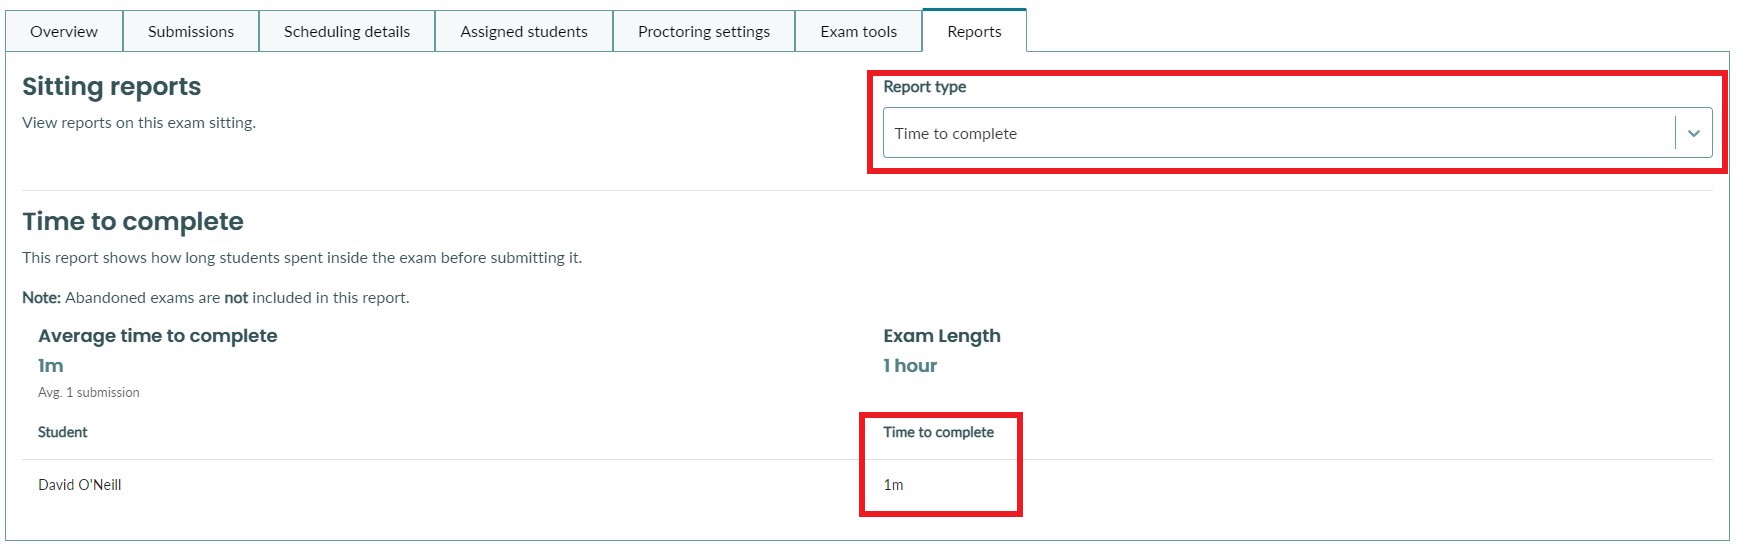
This report will show you how long each student took to complete the exam. It will also show you the average time taken to complete the exam.
To access this report, simply select the 'Time to complete' report from the dropdown menu in the reports tab.
Exam Sitting Engagement
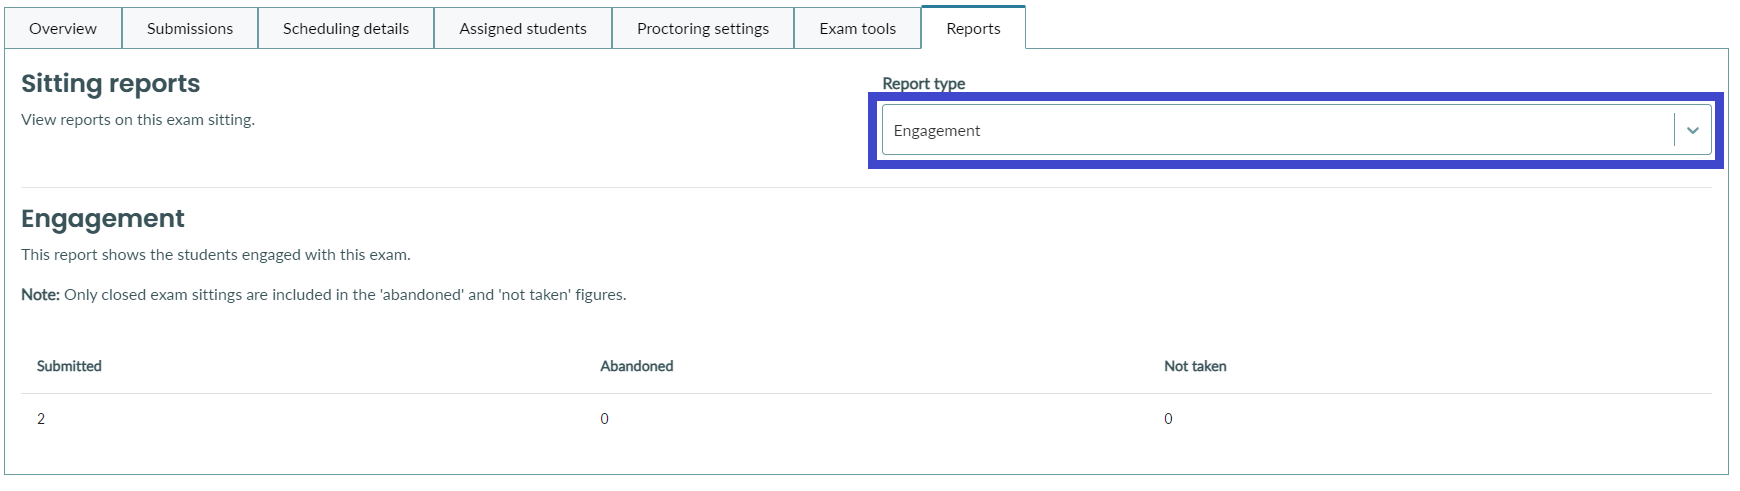
This report will show you engagement levels on your exam sitting. It will tell you how many students completed the exam, how many abandoned it, and how many did not attempt it at all.
To access this report, simply select the 'Engagement' report from the dropdown menu in the reports tab.
Pass/Fail
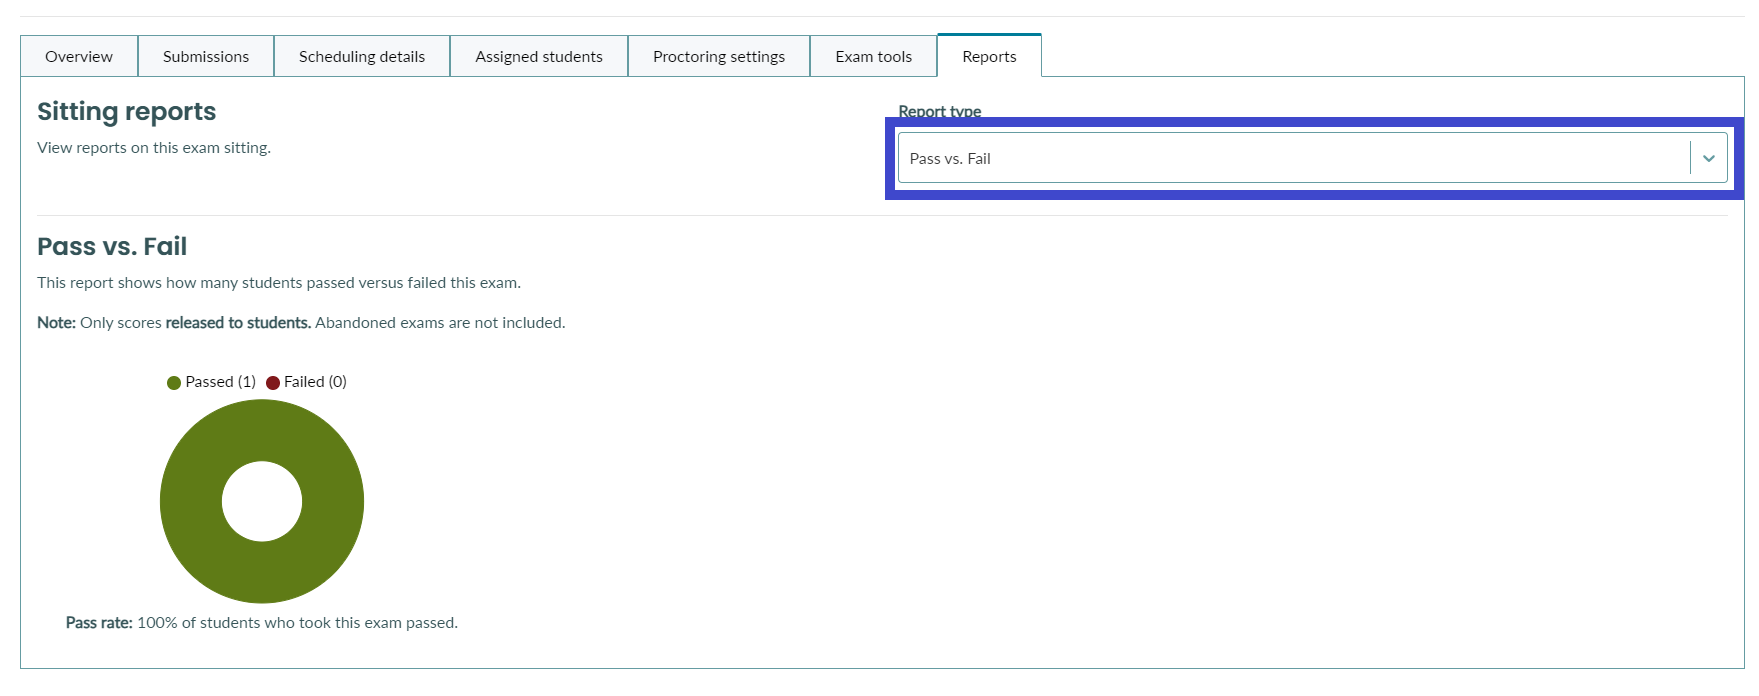
This report will show you how many students passed or failed this exam.
Note: Pass/Fail is calculated when releasing results to students. This report will only include those students whose results have been released.
Note: If results were released before a pass/fail option was enabled on the exam, these students will not appear in this report.
To access this report, simply select the 'Pass/Fail report from the dropdown menu in the reports tab.
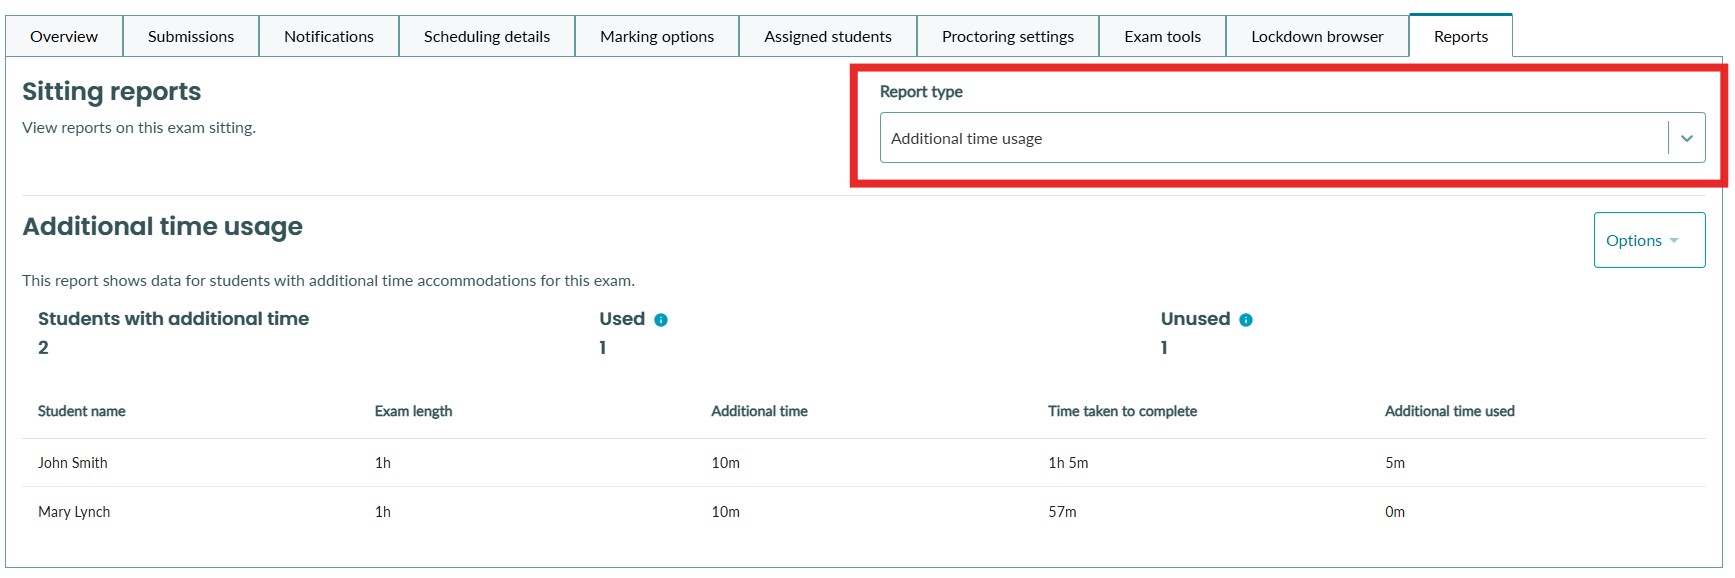
Additional time usage
This report shows how students used the additional time.
What it shows:
- Number of students assigned additional time
- Number of students who used it
- Number of students who did not use it
Table includes:
- Student's name
- Sitting name
- Exam length
- Additional time
- Time taken to complete
- Additional time used
Notes:
- Only submitted or abandoned exams are included
- Time used is rounded to the nearest minute
- Exportable to CSV via the Options dropdown
To access this report, simply select the 'Additional time usage' report from the dropdown menu in the reports tab.