
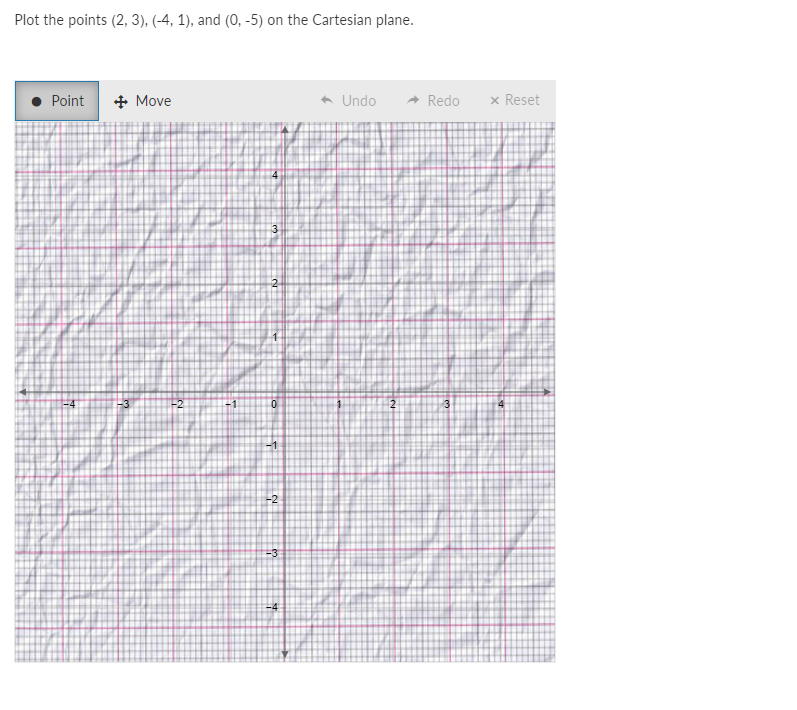
Graphing
The Graphing question type requires students to plot points, lines, and shapes on a coordinate grid.
Description
The Graphing question type requires students to plot points, lines, and shapes on a coordinate grid.
Question Authors can plot different shapes on the graph. See the variety of graph plotting tools below:
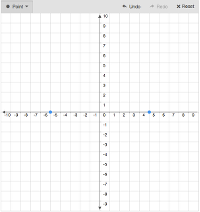
Plot

Line
![]()

Ray
![]()

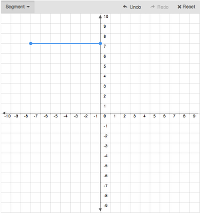
Segment

Vector

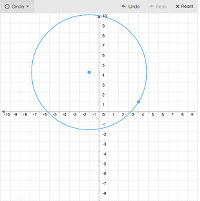
Circle

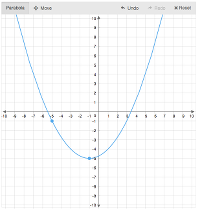
Parabola

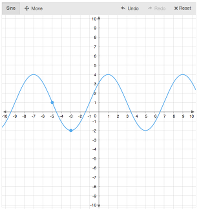
Sine

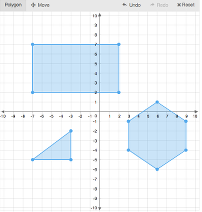
Polygon

Create a question
Enter the question stem into the Compose question area. Below you will see the Graph parameters section. Here you configure the Cartesian plane. Add min and max X and Y axis values as shown below:
Then define graphing tools that will be available for students. In the Tools section, you can add various buttons or even groups of buttons to the toolbar and create the toolbar specified for your question.
There are two options: Add Button and Add Group. To add a single button to the toolbar click on +Add Button. A drop-down menu will appear below. Select the tool from this menu in order for it to appear in the student toolbar.
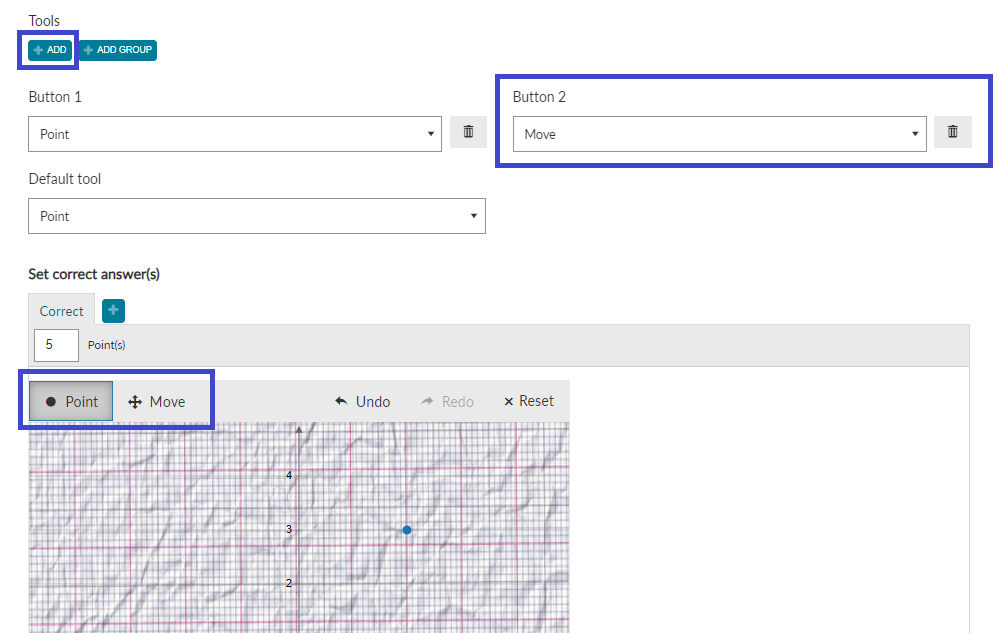
To remove a button simply click on the trash can icon beside it. Alternatively, you can replace the unwanted tool by selecting a new tool from the menu.
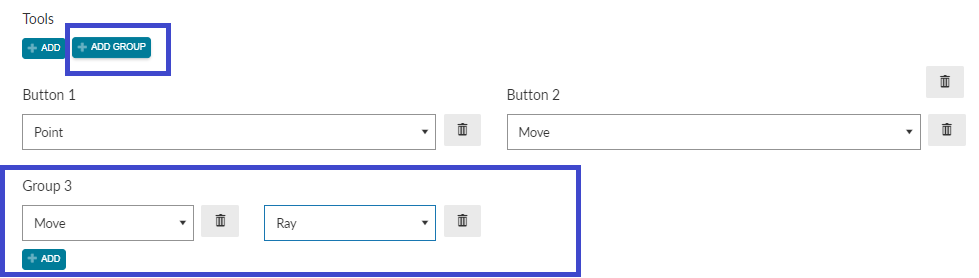
You can also decide to have a set of tools and group them into one drop-down menu in the toolbar. To create a group of tools click on the +Add Group button. You will see a new section called Group below the buttons list. Click on +Add and select the tools you want to add to the group.
Note: these settings only affect students, authors will be able to see all tools when validating the question.
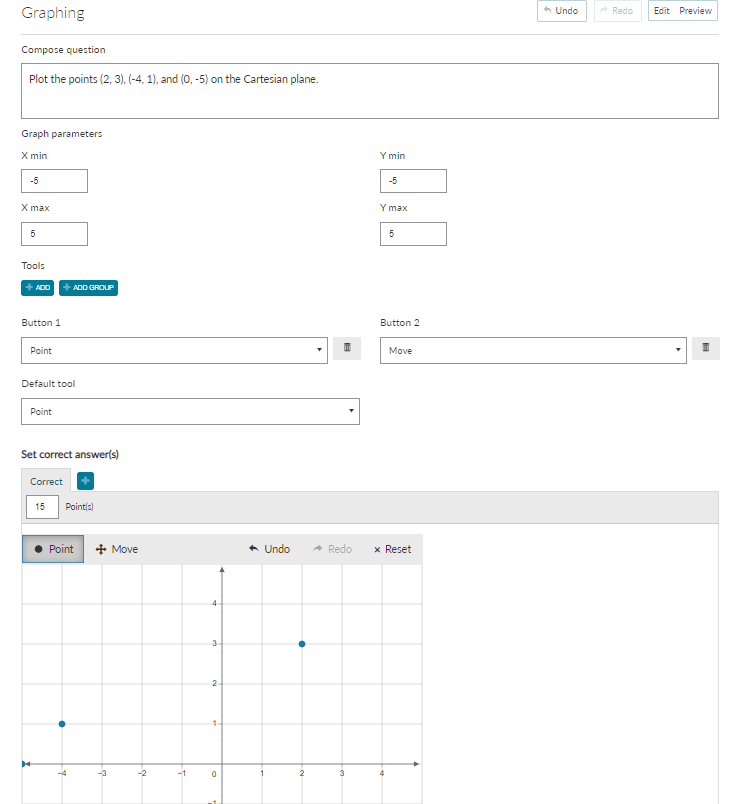
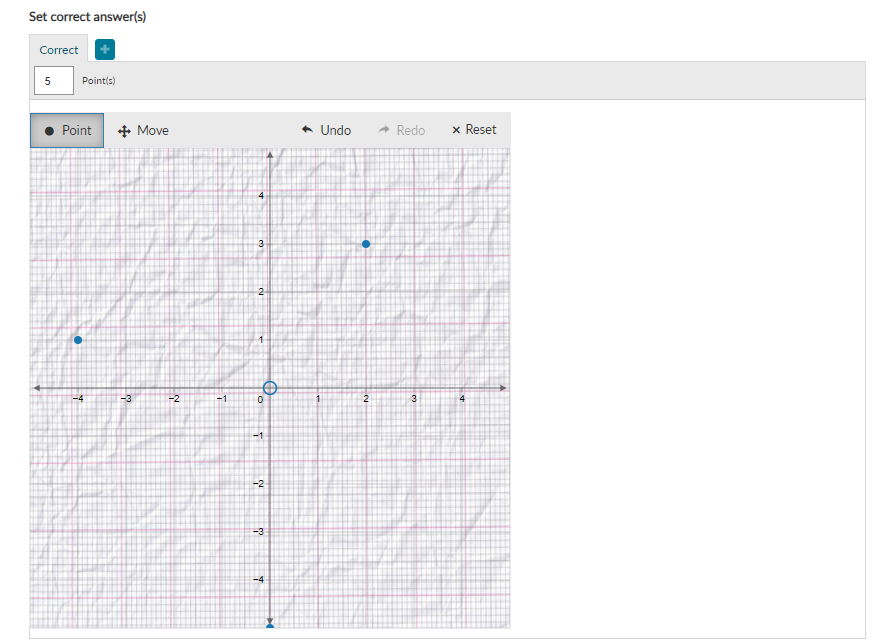
You can now configure validation for your question. Follow these steps to set up a score and correct response:
- Insert value in the Point(s) box to set up a mark for the question. The default value is set to 1.
- In the Correct tab, you will see the cartesian plane you set up. To validate the question plot the correct answer as shown in Figure 5.
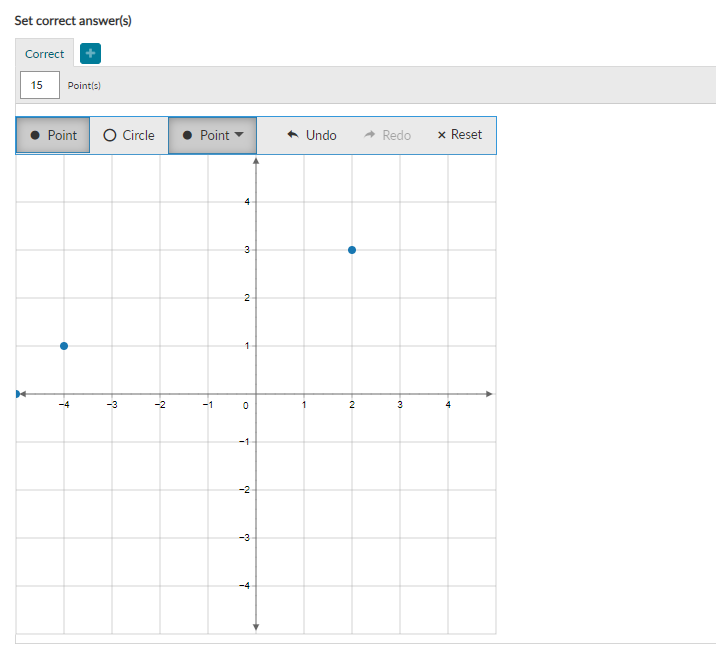
Graph questions are scored only by Exact Match.
More options
Scoring

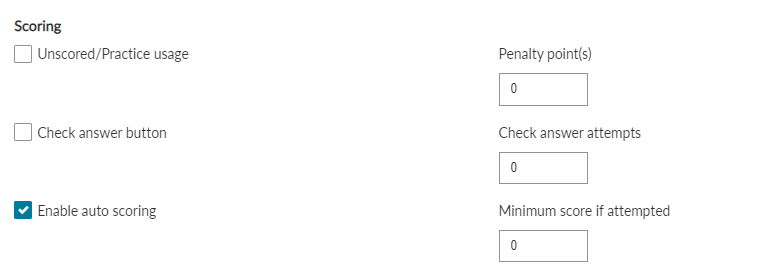
In this section, you can specify the scoring parameters.
Learn more on the scoring overview page.
Layout
In this section, authors can apply additional formatting options. Graph Width and Height can be specified in pixels. Authors can also add a margin around the graph. It can be applied for styling purposes only or as a container for labels that you may decide to add.
The default tool defines a plotting tool that will be enabled when the question is loaded. Select the default tool from the drop-down menu.
The Snap to field defines how a point will snap to the nearest intersect on the graph. Possible values are: "grid", "ticks" or a numeric value. These attributes should be entered in manually.
- With grid snap selected the point will stick to the nearest intersection between grid cells
- Ticks snap is used to snap the point to the nearest intersection between axis ticks. For instance, if ticks distance is 2 then a point can be plotted on the graph every 2nd intersect from 0: (0,2),(0,4),(-2,0), (2,2) (-2,-4) etc.
- You can also use a numeric value. For example, if Snap is set to 4, the point can be snapped in the intersection of every 4 cells on the X and Y-axis.
Show hover position: Enable this option if you want the coordinates of a point to be displayed when hovering over a point or dragging it on the grid.
Grid
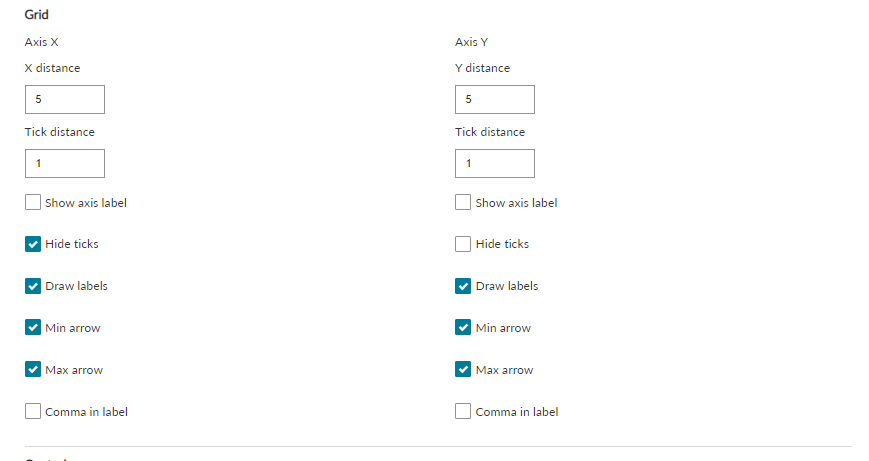
In the grid, section authors can configure the X and Y-axis parameters, such as hide/show arrows and ticks, add labels and define ticks distance. Each parameter should be specified for both axis:
- x_distance represents the distance between grid lines perpendicular to the X-axis and y_distance is the distance between grid lines perpendicular to the Y-axis.
- Ticks Distance defines the distance of each tick on the graph.
- The Hide Ticks defines whether or not to render ticks of each point on the X and Y-Axis of the graph.
- Draw Labels - Enable this option if you want to add numbers under each point on the X and Y-Axis.
- Show first arrow - Displays arrow at the start of the axis.
- Show last arrow - Displays arrow at the end of the axis.
- Comma in label - This can be applied only if you have a labeled graph and more than 1000 labels. This will insert commas to separate thousands in a label.
- Show axis label - Enables a label next to the axis. When turned on the label can be defined in the field below.
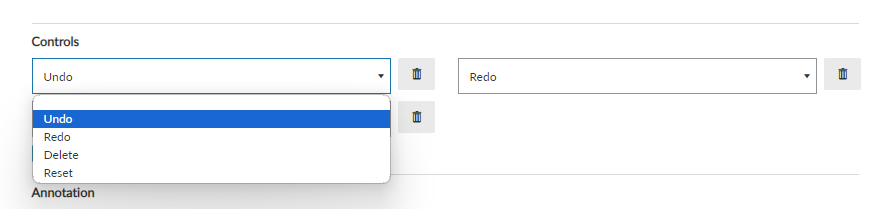
Controls
Here you can specify which control buttons should be displayed in the toolbar. Controls can be added to the toolbar the same way as Tools. To remove a control button simply click on the trash can button beside it.
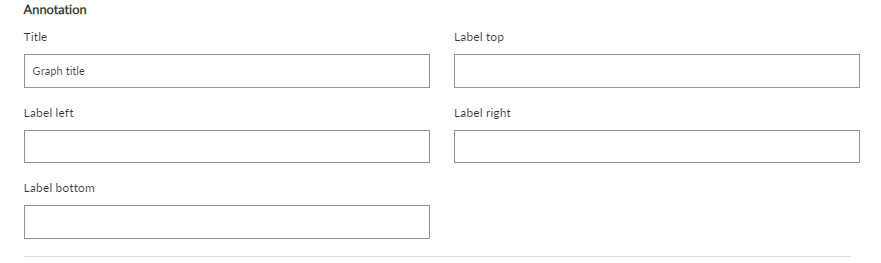
Annotation
In the Annotation section you can add more information to your graph by adding the graph title and/or labels on the top, bottom, left, or right.
Background image
You can also decide to use an image as a grid background. For this use the Background Image option. When you upload an image the following options can be specified:
- X - Position on the X-Axis for image centre. 0 = image centre.
- Y - Position on the Y-Axis for image centre. 0 = image centre.
- Width (%) - Width of the image as a % of the canvas.
- Height (%) - Height of Image as a % of the canvas.
- Opacity (%) - % of image transparency.
You can also add background shapes onto the image background using any of our drawing tools. Note: The student cannot interact with any of the background shapes.
Graphing Accessibility
Graph questions can be interacted by keyboard-only and screen reader users.
Keyboard navigation
Keyboard-only users can tab to the menu and navigate the menu items using arrow keys. Options in the menu can be selected with either the spacebar or the enter key.
The tab key will then take the user to the graph plane where they can navigate the grid using arrow keys. Points can be plotted with the spacebar or the enter key. Pressing shift-tab will take the user back to the menu to select further options.
Note: at this stage, the label tool is unavailable for keyboard-only users.
Screen reader navigation
Screen reader users can use the same keyboard navigation described above.
When navigating to the graph, the screen reader user will be described the content of the graph including the axis values and any background shapes.
When navigating to the menu, the user is notified of the keyboard controls to interact with the menu. All menu options are announced to the user as the arrow through the options.
When tabbing to the graph plane, the user is notified of the keyboard controls to interact with the graph plane. As they navigate around the graph the coordinate locations are announced and as they plot points they are notified of the plotted point and its coordinate.
When the user presses shift-tab to go back to the beginning of the graph, they are notified of all points or shapes plotted.